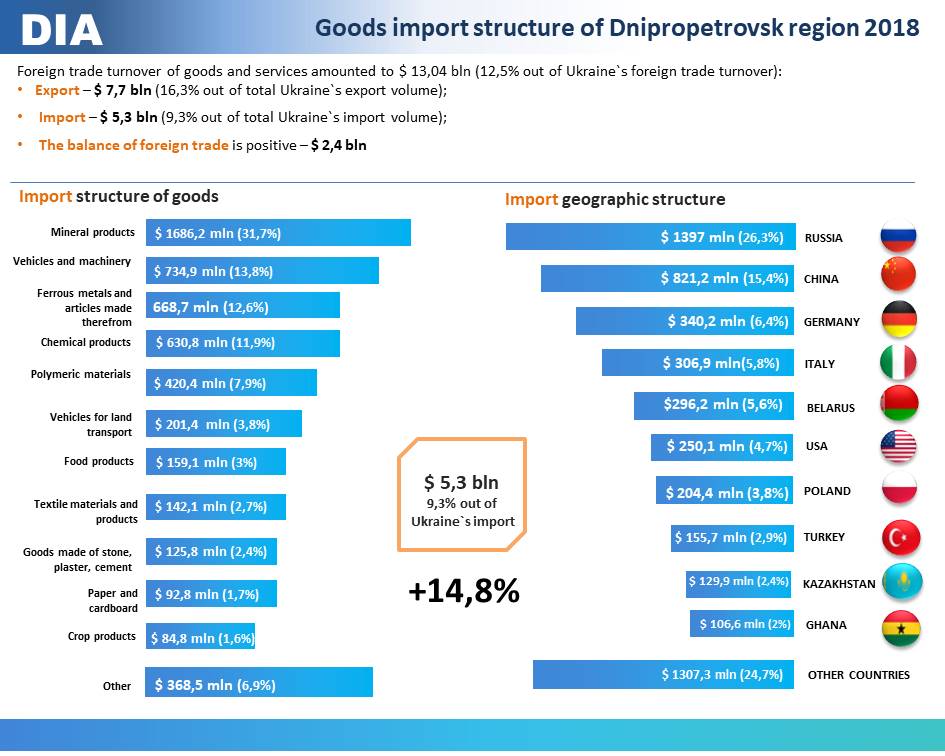
Dnipropetrovsk region goods import from other countries in 2018 amounted to $ 5,3 bln (9.3% of Ukrainian import). It should be noted that compared to last year, goods import increased by almost 15%. The surpluses were $ 2,4 bln, exports exceeded imports by 31.2%
The largest part (90,5%) in the goods import is industrial products in the amount $ 4,8 bln.
The agricultural sector products and food industry products with a share of 7,1 % were imported in the amount of $ 376,1 mln, construction products (2,4% in the amount of $ 125,8 mln).
Imports from the EU countries to the Dnipropetrovsk region grew by 6% compared with last year and amounted to about $ 1,6 bln.
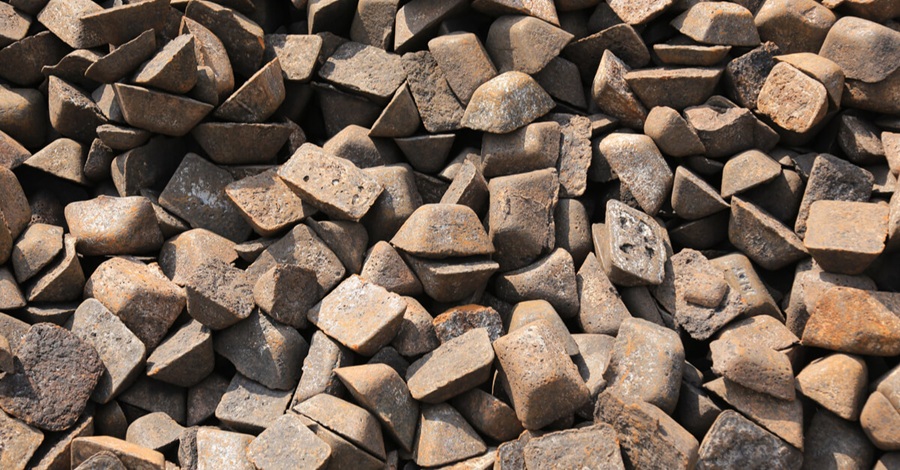
Among the countries, which products were bought more by the Dnipropetrovsk region, the Russian Federation is leading, import of which grew by 16.6% compared to last year and amounted to $ 1.4 bln. Mineral products, polymeric materials, ferrous metals, machinery and equipment were imported to the Dnipropetrovsk region.
The second place was taken by China, goods import from which grew by 34% compared with last year and amounted to $ 821.2 mln. Mineral and chemical products, polymeric materials, ferrous metals, paper and cardboard, goods made of stone, plaster, cement and toys were imported from this country.
In third place is Germany, the goods import from which grew by 3% compared with last year. Import amounted to $ 340,2 mln. Ukrainian consumers are interested in German food and pharmaceutical products, polymeric materials, cardboard and paper, machinery, equipment and vehicles for land transport.
In fourth place is Italy, imports from this country grew by more than 2 times and amounted to $ 306.9 mln. Mineral products, chemical products, ferrous metals and products from them, machinery and equipment were imported.
The volume of imports to the region has significantly increased, by more than 50%, compared to 2017, from such countries as Algeria, Belarus, Georgia, Israel, the United Arab Emirates. Import operations were carried out with partners from 158 countries.
It should be noted that compared with last year, the volume of imports for certain types of products increased significantly.
The agricultural and food industry:
Processing industry:
Construction products: