Export.
Export of goods from Dnipropetrovsk region to the world in the first half of 2019 increased by 4.7% compared to the previous period of 2018 and amounted to $ 4.2 bln (17.2% of Ukraine’s exports). Exports exceeded imports by 35.4% – this is the first indicator among the regions of Ukraine. The surplus amounted to $ 1.5 bln.
The largest share (94.3%) in the export of goods is occupied by industrial products. The region exported more than a quarter of Ukraine’s industrial output to the amount of $ 3.96 billion.
Agroindustrial and food products with a share of 5.3% were exported to the amount of $ 221.99 mln, construction products (0.4% amounted to $ 19.3 mln).
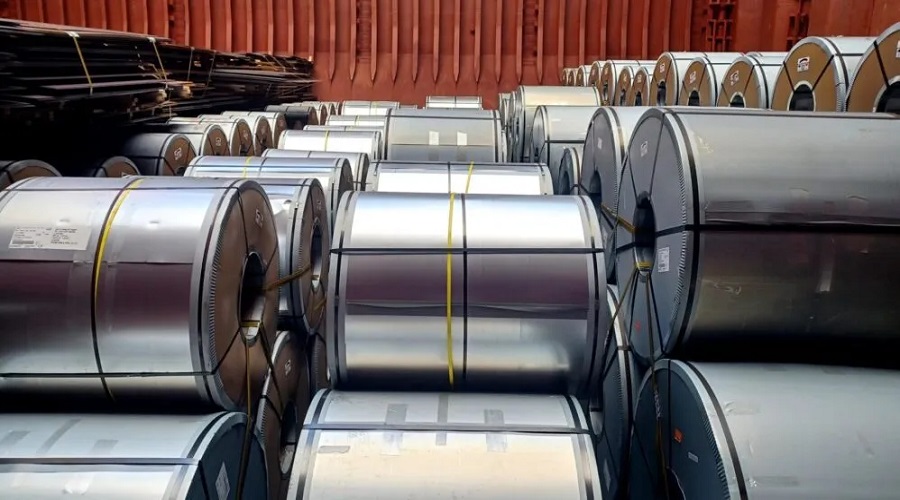
The structure of exports consists of ferrous metals and their products, the export of which amounted to $2,220.8 mln (52.8% of the total volume of exports), ores exported by $1143.4 mln (27.2%), fats and oils exported by $123 mln (2.9%).
China became the leader among Ukrainian consumers. Exports to this country increased by 56% compared to the same period in 2018 and amounted to $ 413.9 mln.
Poland ranks the second among the world’s consumers of the region’s products, though exports to which decreased by 3.3% compared to the previous period of 2018, the country still hold the leading position. Exports amounted to $ 363.9 mln.
The Russian Federation is the third largest global consumer of the region’s products; exports increased by 2.5% and amounted to $ 276.1 mln.
Egypt is in the fourth place. Exports to this country increased by 6.8% and amounted to $256.8 mln.
Egypt is in the fourth place. Exports to this country increased by 6.8% and amounted to $256.8 mln. The volume of exports from the region increased significantly compared to the corresponding period of 2018, to such countries as: Japan (exports increased almost ninefold), Australia, Indonesia and the Republic of Korea (exports to these countries increased more than sixfold), Nigeria (almost fivefold), Ethiopia, Luxembourg, Slovenia, Turkmenistan, Sri Lanka (more than twice). Export operations were conducted with partners from 149 countries.
It should be noted that in comparison with the corresponding period of the previous year, the volume of exports by particular products increased significantly:
Imports.
Imports of goods to Dnipropetrovsk region increased by 13.5% ($ 2.7 bln) compared to the corresponding period of the last year, which is 9.6% of the national figure.
Dnipropetrovsk region mostly bought:
The Russian Federation is the leader among the countries which products were purchased by Dnepropetrovsk region, imports increased by 8.2% compared to the corresponding period of 2018, amounted to $ 693.7 mln. The second place in the import of goods is occupied by China, the import from which increased by 41% compared to the corresponding period of the last year and amounted to $ 465.6 mln. Germany is the third among the world importers, imports increased by 10.4% and amounted to $ 182 mln.
Top – 3 countries that have significantly increased the volume of product supply to the market of Dnepropetrovsk region:
Foreign trade operations were conducted with partners from 132 countries.
The following commodity item of imports from the countries of the world showed a significant increase in the volume of products supply to the market of Dnepropetrovsk region: