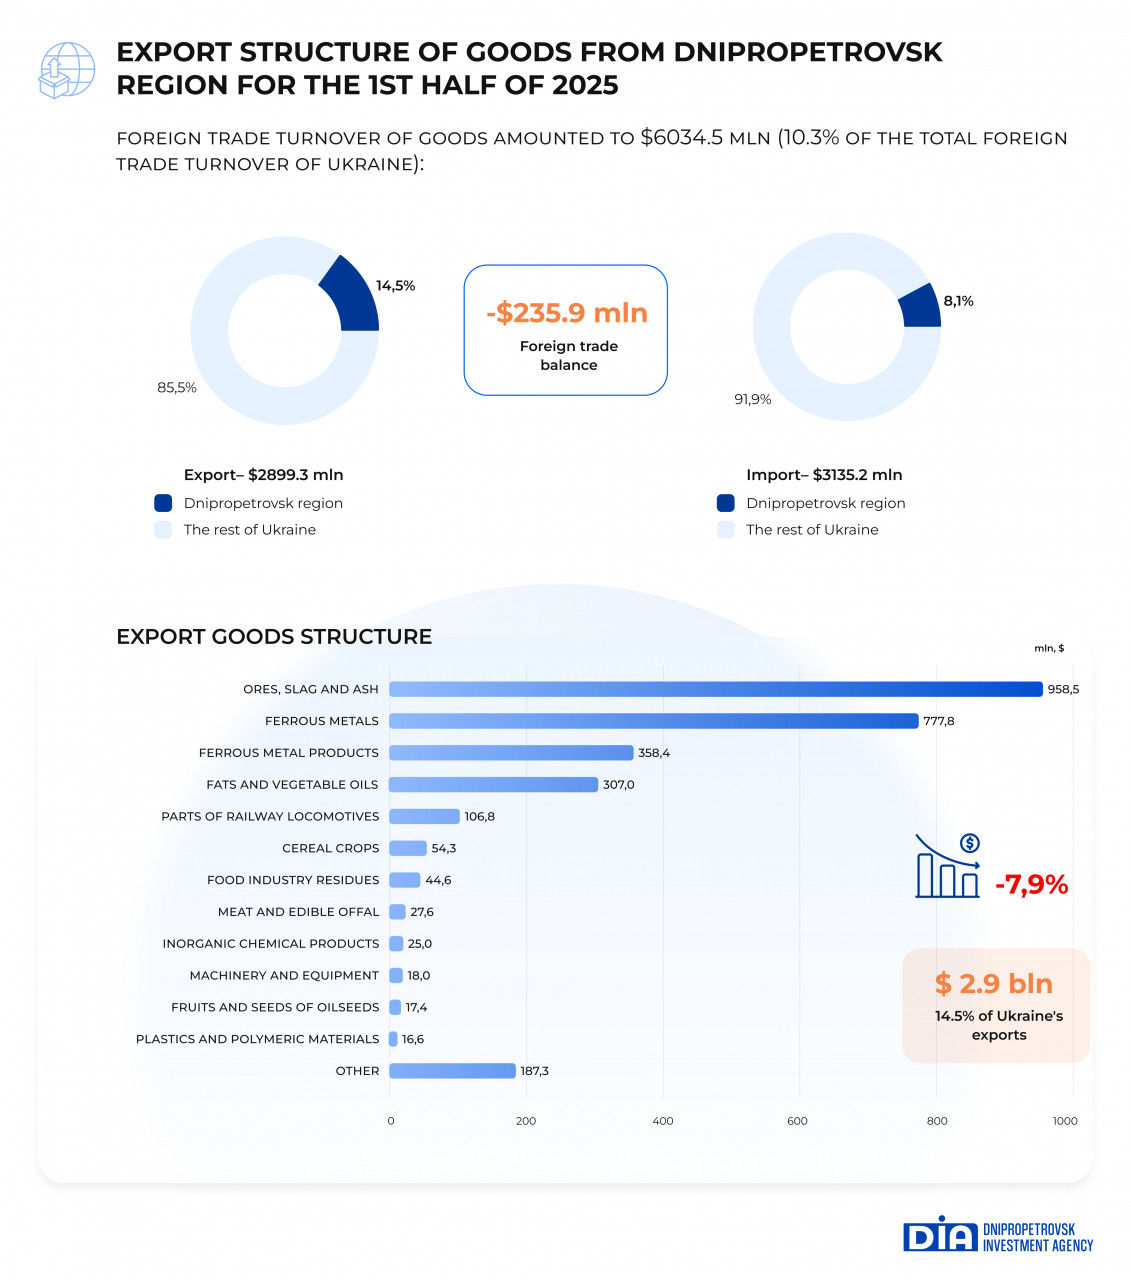
Dnipropetrovsk Investment Agency keeps introducing about the results of foreign trade operations with goods in Dnipropetrovsk region for the first half of 2025. The recovery of the economy even during the war demonstrates an increase in trade turnover by 7.3%, which amounts to $6 billion, that provides 10.3% of the total volume of Ukraine.
For the first time, the foreign trade balance became negative and amounted to $235.9 million. This is explained by the decrease in the level of exports of mineral products and agricultural products, against the background of an increasing need for resources, components and equipment necessary for the restoration of business in the region.
In the first half of 2025, enterprises of Dnipropetrovsk region reduced exports by almost 7.9%, supplying products worth $2899.3 million to foreign markets, which is 14.5% of Ukraine’s total exports. Despite the overall decrease, the region maintains its leading position in terms of exports of ferrous metallurgy, iron ore, land transport vehicles, as well as agricultural products, oils and fats.
Main export goods of the region:
Also, there has been a rise in the export volumes of the following types of goods:
Poland became the leader among consumers of Ukrainian goods. Exports to this country stayed at the level of the same period in 2024 and amounted to $447.3 million (15.4% of the total export volume of the region).
China took second place among the world’s consumers of Ukrainian goods. Exports to the country decreased by 25.3% compared to the previous period and amounted to $414.6 million (14.3%). Slovakia ranked third, with exports decreasing by 11.8% to $251.1 million (8.7%).
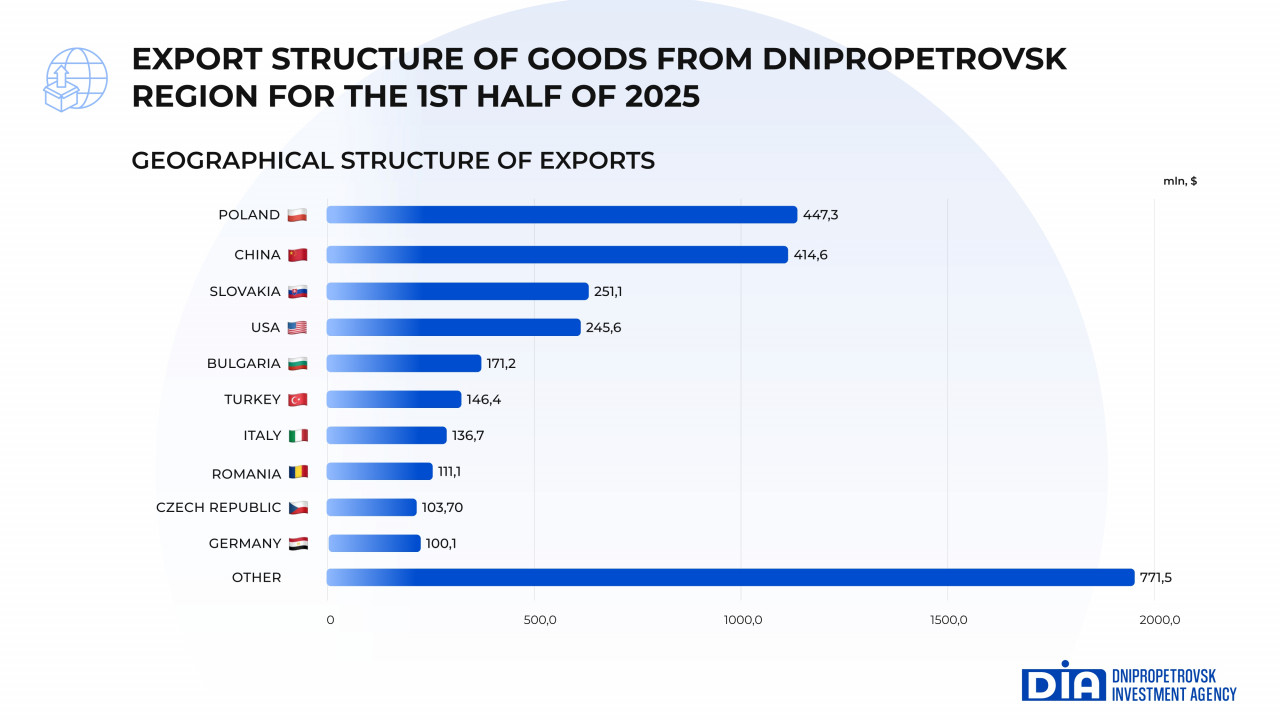
The volume of goods being exported to Brazil, Vietnam, Hong Kong, India, UAE, North Macedonia, and Portugal has significantly increased.
The volume of imports of goods to Dnipropetrovsk region in the first half of 2025 increased by 23% and reached $3135.2 mln, which is 8.1% of total imports of Ukraine. This increase is explained by the recovery of the region’s economy, which is:
In particular, imports are concentrated in the following categories: mechanical engineering products, chemicals, medical rehabilitation equipment, equipment and machinery for upgrading industrial sites.
The most popular supplies among local consumers stayed mineral resources, electrical machinery, ferrous metals, machinery and equipment, pharmaceutical products and polymeric materials.
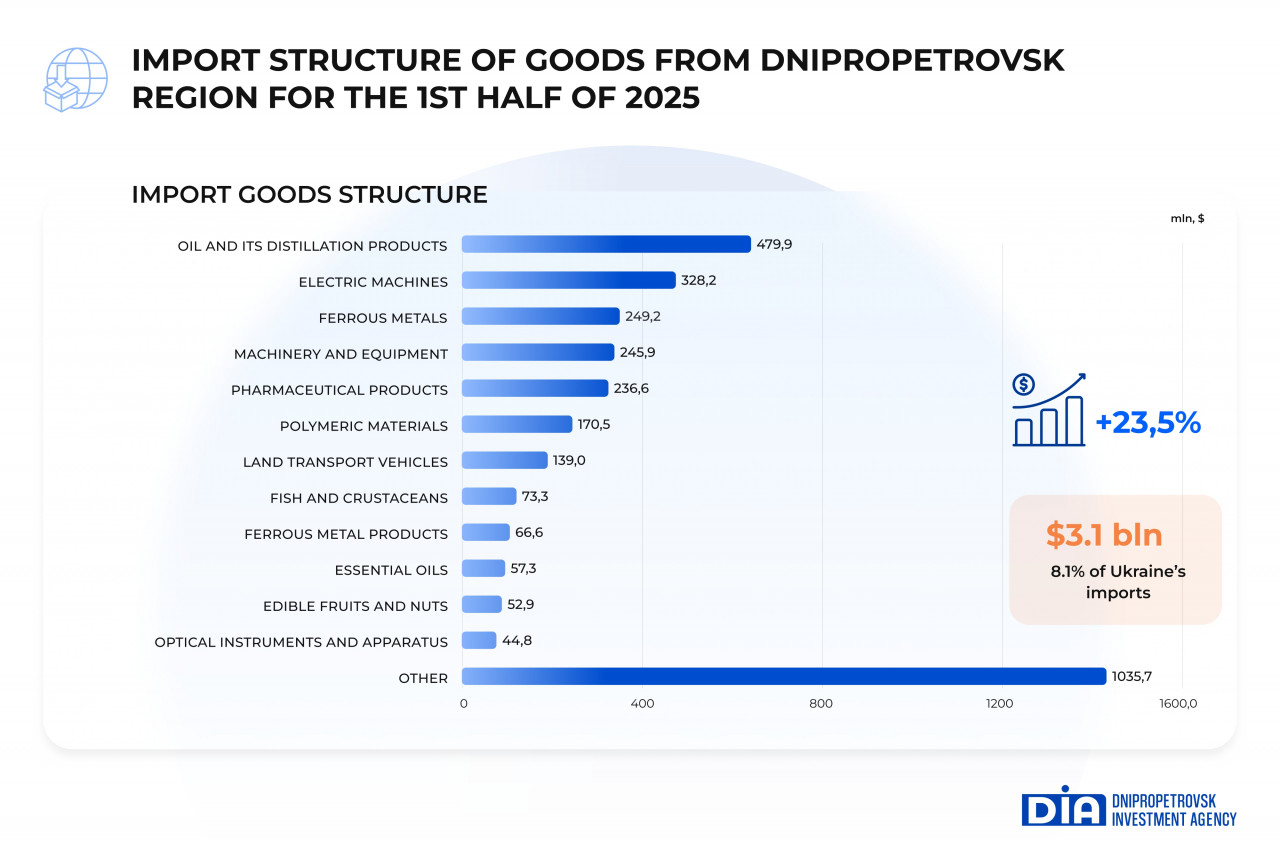
Compared to the corresponding period of 2024, import volumes of the following types of goods increased significantly, namely:
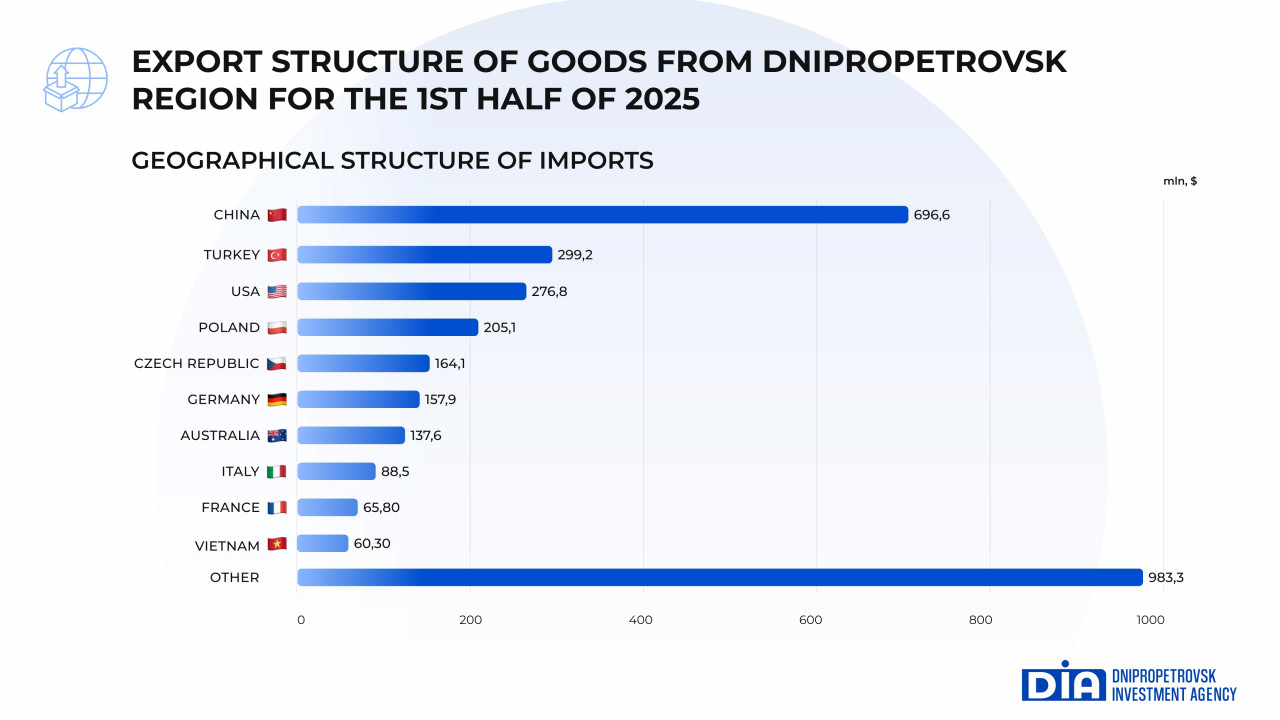
Among the countries whose products are of the greatest interest to Dnipropetrovsk region, China leads with a positive growth dynamic — an increase of 15.9%, amounting to $696.6 million. Turkey ranks second, with imports from this country rising by 16.3% to $299.2 million. The United States takes third place, with imports amounting to $276.8 million, which is twice as high as in the first half of 2024.
Imports from Australia, Vietnam, Denmark, Egypt, Indonesia, Ecuador, Canada, Morocco, Norway, USA increased more than 2 times.
Foreign trade operations were carried out with partners from 152 countries worldwide.