
EXPORTS
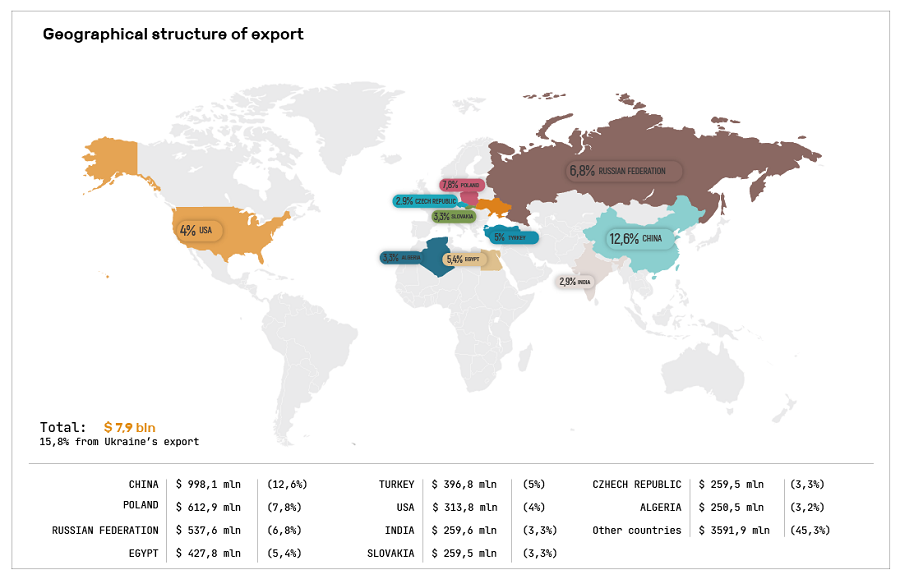
Export of goods from Dnipropetrovsk region to the world countries in 2019 amounted to $7.9 bln (15.8% of Ukraine’s export volume).. Exports of goods exceeded imports by 30%. This is the first indicator among the regions of Ukraine. The positive balance was $ 2347.5 mln.
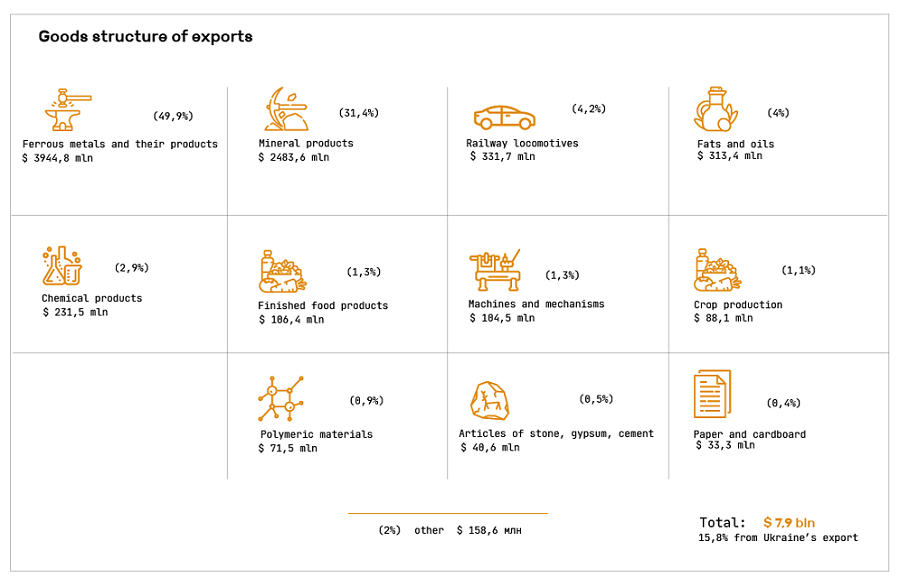
Industrial products account for the largest share (92.6%) in goods exports. The region exported more than a quarter of Ukraine’s industrial products at the amount of $7.3 bln. The largest share of exports was represented by ferrous metals and their products 49,9 % ($ 3,9 bln), as well as ore and slag 31.4% ($2.3 bln). It should be noted that the share of these products in Ukraine’s exports was 38.5% and 62.7%, respectively.
Products of agro-industrial complex and food industry with the share of 6.7% were exported for $543.8 mln, while construction products (0.5%) ̶ for $40.6 mln.
Export volumes of products have increased significantly, some of which are not traditional for the region:
China is the leader among consumers of Ukrainian goods. Exports to this country increased by 67.7% compared to 2018 and amounted to $998 mln. Exports to China were made of: ores and slag by $923.1 mln ((92.5% of total exports to China), fats and oils by $51.5 mln (5.2%), ferrous metals by $12.8 mln (1.3%), exports of which increased by 7 times compared to the last year.
Poland ranks second among the world consumers of the region’s products in the region. Exports to the country decreased by 14.3% compared to the last year, but still holds the leading position. Exports amounted to $612.9 mln. Ores and slag were exported to Poland by $386.6 mln (63.1% of total exports to Poland), ferrous metals and their products by $163.9 mln (26.7%).
In third place among world consumers of the region’s products is Russia. Exports to the Russian Federation have had a negative trend for several consecutive years, and decreased by 10.4% in 2019. Exports amounted to $537.6 mln::
Exports of goods to Peru, Nigeria, Australia, the Republic of Korea, Saudi Arabia, Luxembourg, Sri Lanka and Japan have doubled.
IMPORTS
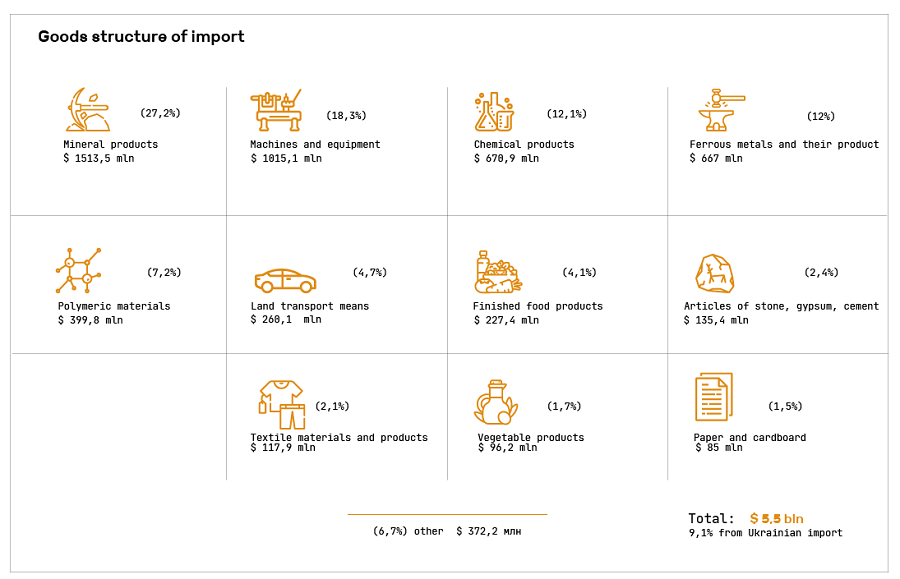
Imports of goods from the world in 2019 amounted to $5.5 bln (9.1% of Ukraine’s imports).
The largest share (90.5%) in the import of goods is occupied by industrial products worth $4.9 bln.
Products of agro-industrial complex and food industry with a share of 8.7% were imported to the amount of $481,9 mln. While construction products (2.4%) ̶ worth $135,4 mln.
In comparison with the previous year, the volumes of import, first of all, of goods of the processing industry have increased significantly:, in particular::
Among the countries of the world, whose products were most imported by Dnіpropetrovsk region, Russia is leading with negative dynamics (decrease by 12.5%) with the volume of $1,222.6 mln. Mineral fuels imported by $762.6 mln (62.4% of total imports of the Russian Federation) and ferrous metals and their products for $245 mln (20%).
The second place was taken by China, whose imports increased by 26.3% compared to 2018 and amounted to $1037.5 mln. From this country were imported::
Germany is in the third place. Imports amounted to $362.5 million and increased by 6.5% compared to the last year. Ukrainian consumers bought:
Imports from Jordan, Lebanon, Egypt, Ethiopia increased more than twice.
Foreign trade operations were conducted with partners from 165 countries.