Dnipropetrovsk Investment Agency keeps introducing about the results of foreign trade operations with goods in Dnipropetrovsk region for 9 months of 2025.
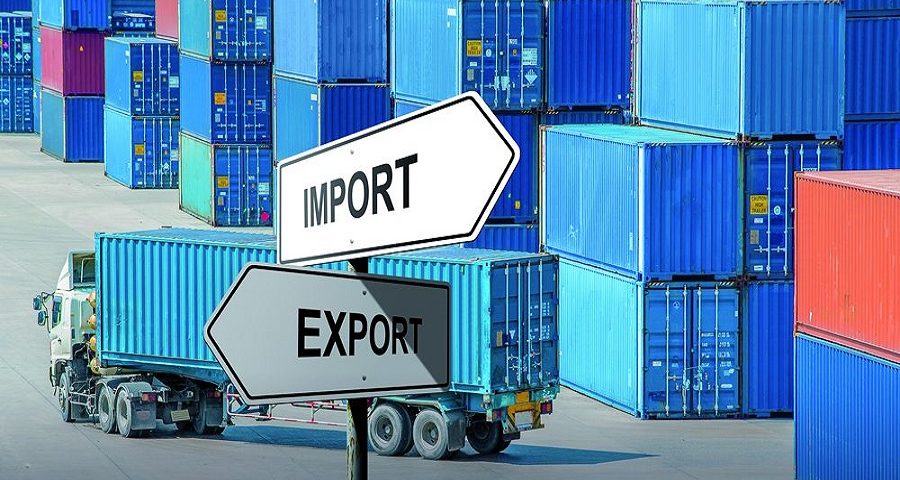
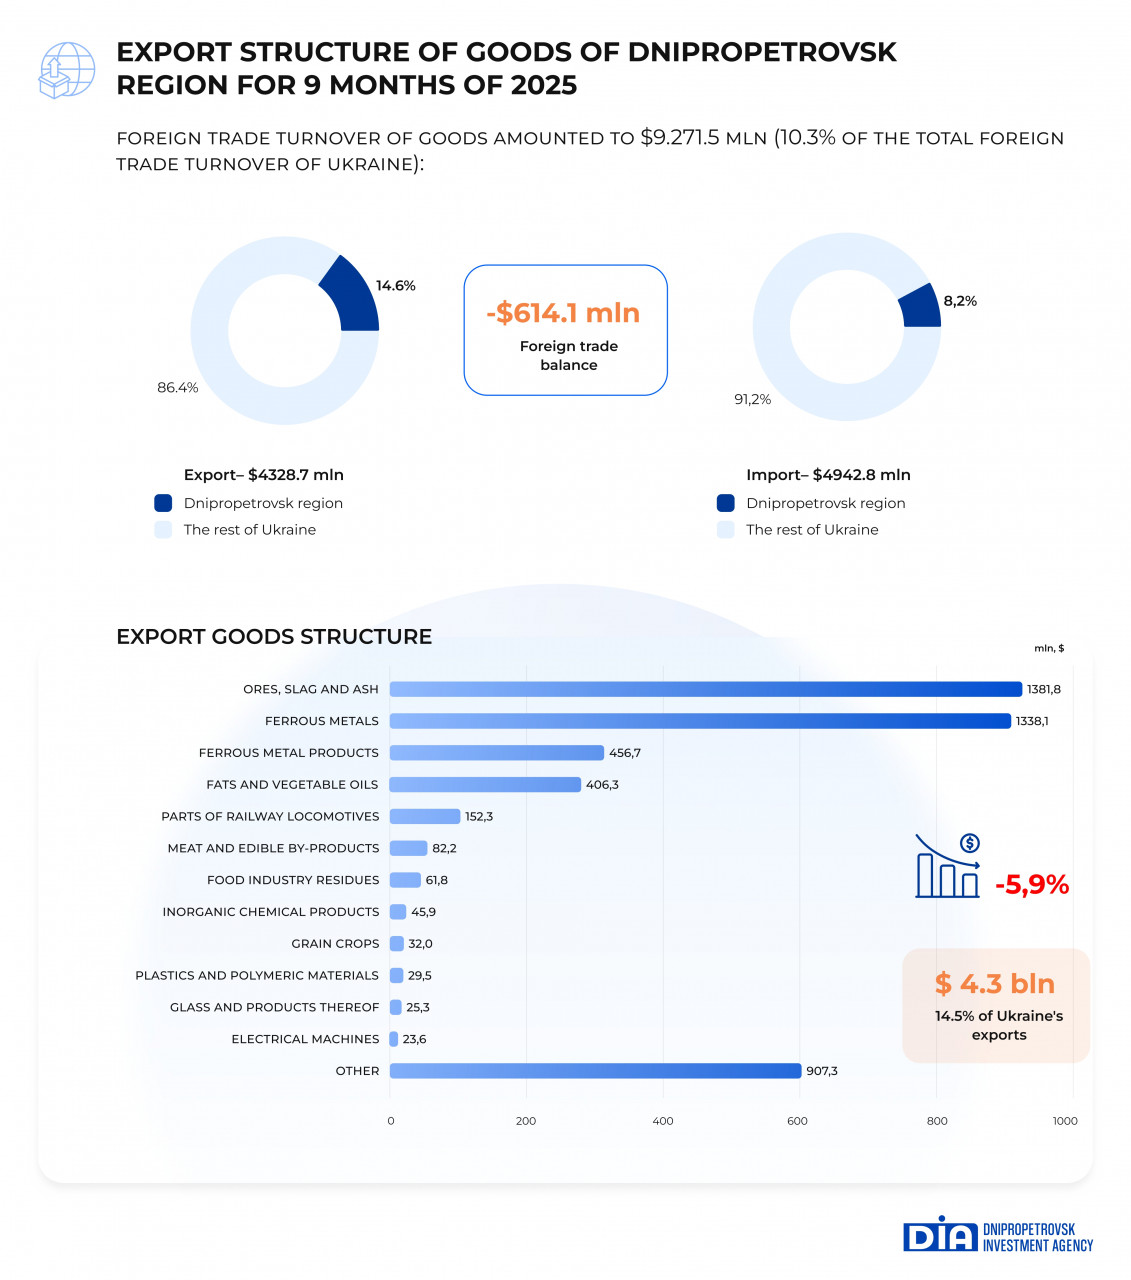
The recovery of economic activity, even during a full-scale war, contributed to a 9% increase in trade turnover to $9.3 billion, which accounts for 10.3% of total foreign trade turnover in Ukraine. The recovery in trade shows how businesses are slowly adapting to the challenges of war, changing logistics routes and partly recovering their production capacity.
At the same time, in 2025, the foreign trade balance of the region became negative for the first time and amounted to $614.1 million. The main factors behind this result were a decline in exports of metal ores and vegetable oil, against the growth of imports of resources, components and industrial equipment needed for the reconstruction of enterprises and investments.
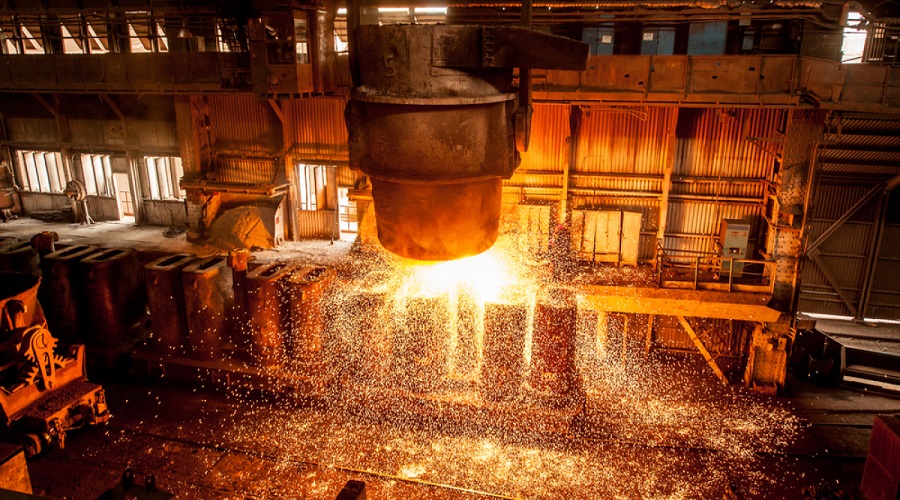
According to the results of the nine months of 2025, enterprises in Dnipropetrovsk region reduced their exports by 5.9%, supplying products worth $4,328.7 million to foreign markets, which corresponds to 14.6% of total Ukrainian exports. Despite the overall decline, the region remains a leader in Ukranian exports, particularly in the ferrous metallurgy, iron ore, land transport equipment and certain types of agricultural products, including vegetable oils and fats.
Main export goods of the region:
Also, there has been a rise in the export volumes of the following types of goods:
Poland became the leader among consumers of Ukrainian goods. Exports to this country stayed almost at the 2024 level and amounted to $659.1 million (15.2% of the total volume of exports from the region).
China took second place among global consumers of the product from the region. Exports to the country decreased by 11.4% compared to the previous period and amounted to $620.2 million (14.3%). In third place was the United States, with exports increasing by 64.4% to $395.5 million (9.1%).
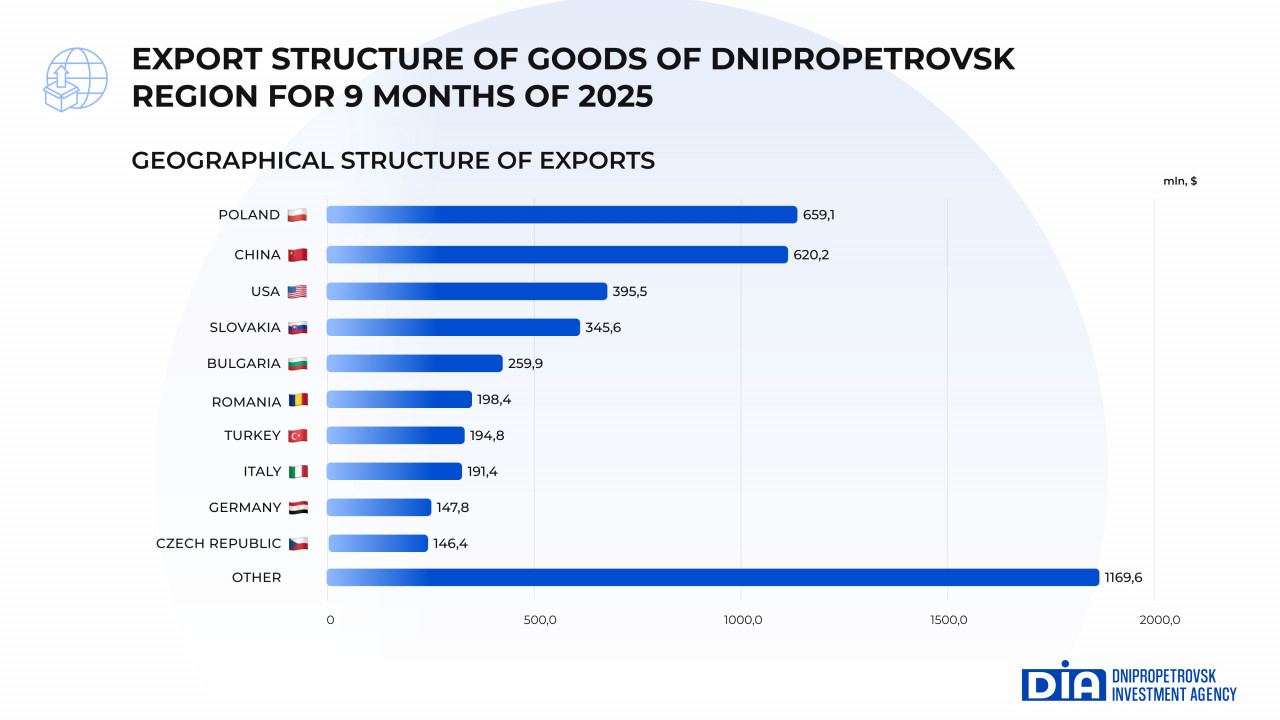
The volume of exports to Algeria, Great Britain, Hong Kong, Jordan, Mauritania, Malaysia, the UAE, North Macedonia and Portugal has increased significantly.
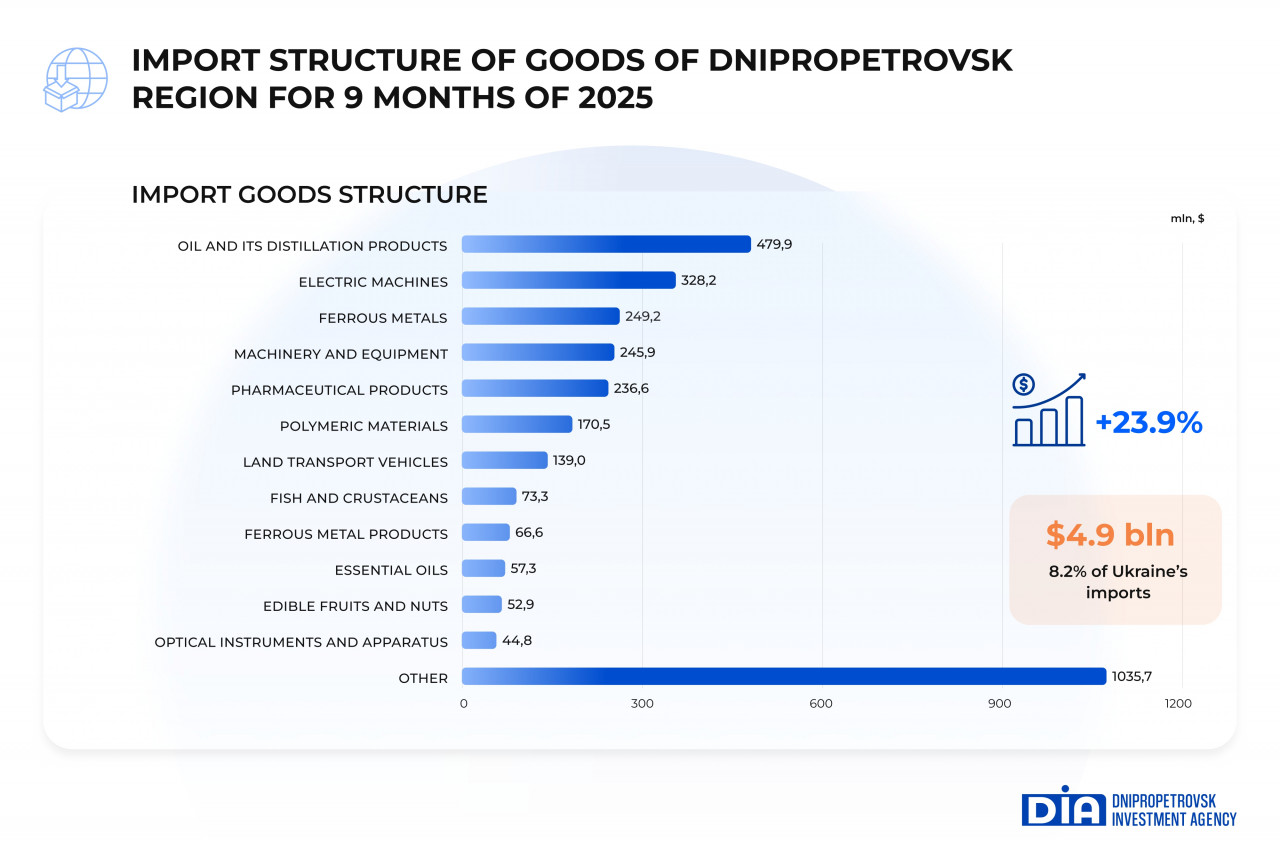
In the nine months of 2025, the volume of goods imported into Dnipropetrovsk region increased by 23.9% and reached $4,942.8 million, which is 8.2% of total Ukrainian imports. This significant growth is due to the gradual recovery of economic activity in the region, in particular:
The main volumes of imports are concentrated in the following product categories: mechanical engineering products, chemicals, medical equipment (including for rehabilitation), as well as machinery and equipment for the modernisation and reconstruction of industrial facilities.
Mineral products, electrical machinery, ferrous metals, machinery and equipment, pharmaceutical products and polymer materials stay the most popular among Ukrainian consumers.
Compared to the same period in 2024, imports of the following types of goods increased significantly:
Among the countries whose products are most in demand in Dnipropetrovsk region, China leads with positive dynamics (an increase of 25.2%) with a volume of $1,188.4 million. Turkey is in second place, with imports of goods increasing by 2.6% to $418.7 million. The United States is in third place. Imports amounted to $408.3 million and increased by 89.2% compared to the same period in 2024.
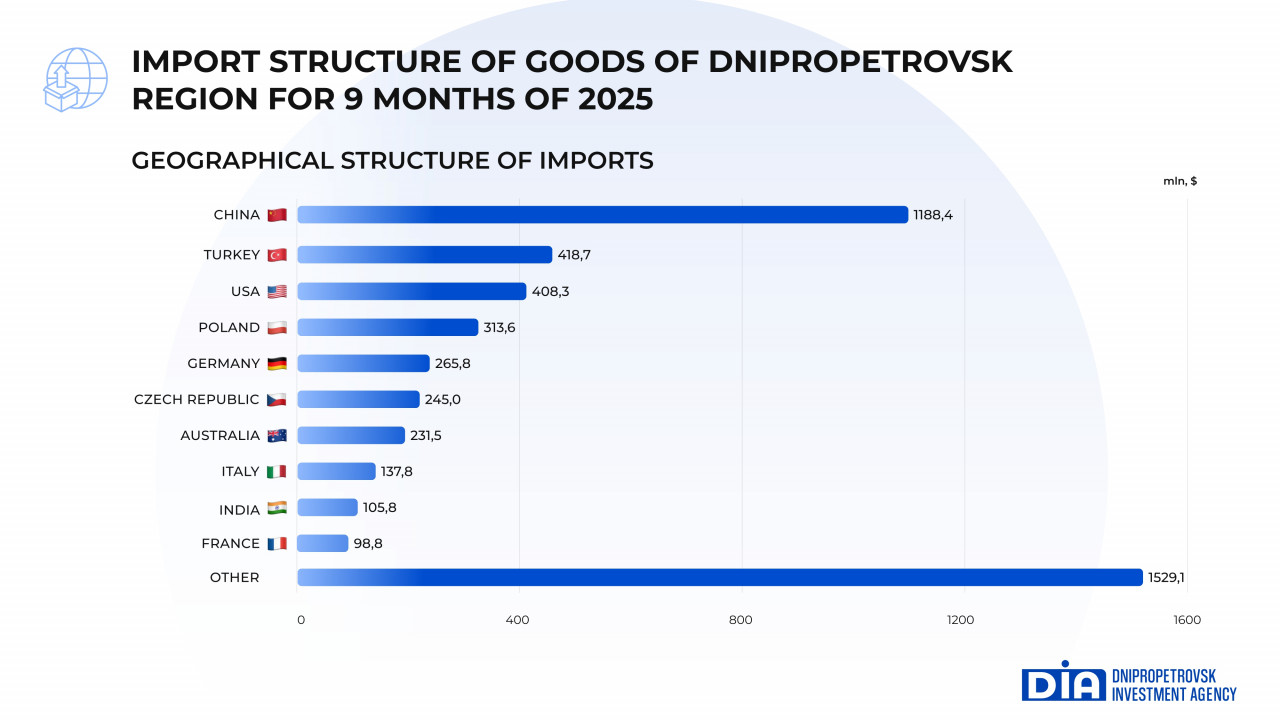
Imports from Australia, Vietnam, Denmark, Jordan, Costa Rica, Peru, Oman, Norway, and Tanzania increased more than twice.
Foreign trade operations were carried out with partners from 159 countries around the world.