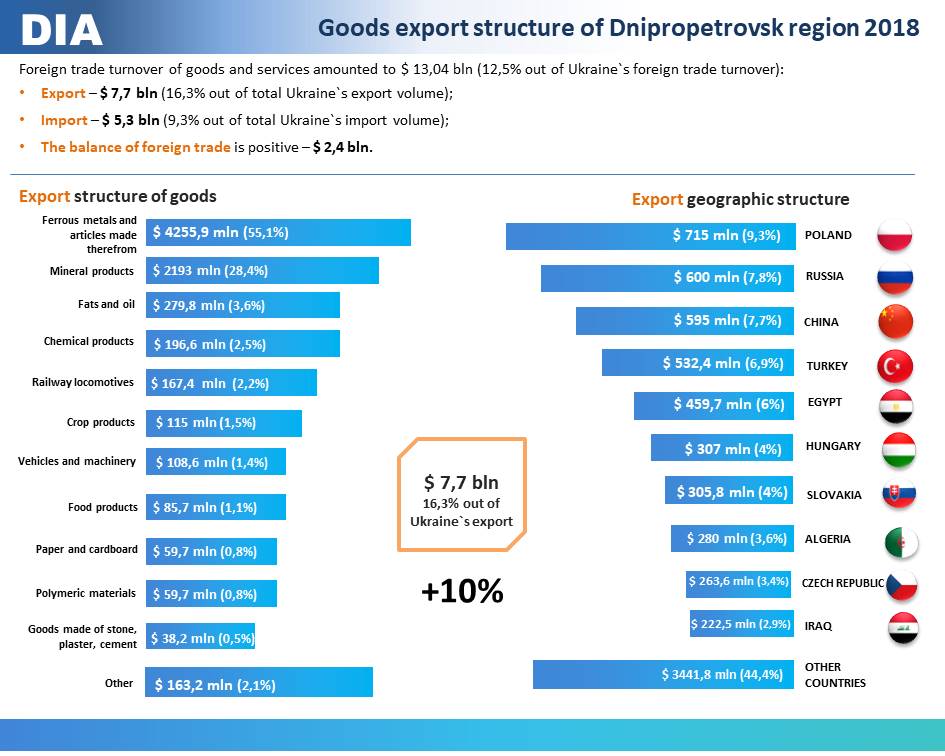
Goods export from the Dnipropetrovsk region to other countries in 2018 amounted to $ 7.7 bln (16.3% out of Ukraine export) and exceeded import by 31.2% which is the first indicator among the Ukraine regions. It is worth noting that compared to last year, goods export increased by almost 10%.
The largest part (92.8%) of the goods export is industrial products. The region exported more than a quarter of Ukraine industrial products in the amount of $ 7.17 bln.
The agricultural sector products and food industry products with a share of 6.7% were exported in the amount of $ 0.515 bln, construction products (0.5% in the amount of $ 38.2 mln).
Poland became the leader among Ukraine goods consumers. Export to this country grew by 35.4% compared with 2017 and amounted to $ 715 mln. Grain crops, oil plants seeds and fruits, fats and oils of vegetable or animal origin, as well as ores, slags, ferrous metals and wood were exported to Poland.
The second place among the world’s consumers of the region’s products took Russian Federation, export to which had decreased by 8.2% compared to last year, but still holds the leading position. Export amounted to $ 600 mln.
China is in third place among the world’s consumers of the region’s products, exports to which also decreased by 11.5% compared with last year. Export amounted to $ 595 mln.
In fourth place is Turkey, exports which also decreased by 10.3% and amounted to $ 532.4 mln.
Export from the region increased significantly by more than 50%, compared with 2017, to such countries as the USA, France, Greece, Belgium, Indonesia, Senegal, Singapore and Hungary. Export operations were conducted with partners from 159 countries of the world.
It is worth noting that export of certain products types increased significantly compared with the previous year.
The agricultural and food industry:
Processing industry:
Construction products: